Vector Spaces ≡ Linear Spaces
A vector space over a field F is a set V together with two binary operations that satisfy eight axioms listed on this Wiki page. Basically, commutativity, associativity, identity and inverse of vector addition plus distributivity, identity etc of scalar multiplication.
A example in geometry of a vector space is arrows in a plane - adding vectors to form a parallelogram.
Another example are linear equations, e.g.:
a + 3b + c = 0
4a + 2b + 2c = 0
The coefficients can be turns into a matrix and (a, b, c) into a vector such that:
A x = 0
where A is the matrix, x the vector and 0 = (0, 0), the zero-vector.
Definition of a Topology
Let X be a set and T be a family of subsets of X. T is called a topology on X if:
∅ ∈ T and X ∈ T
Where ∀ α, Uα ⊂ T and α is potentially infinite:
∪αUα ∈ T (≡ T is stable by arbitrary union)
Where ∀ α, Uα ⊂ T and α is finite:
∪α∩α ∈ T (≡ T is stable by finite intersection)
Example 1
If X = {1,2,3,4,5}, then
T1 = {∅,{1,2},{3,4},{1,2,3,4},X}
and
T2 = {∅,{1,2},{2,3},{2},{1,2,3},X}
are both topologies on X.
Example 2
The trivial topology equals {∅,X} and the discreet topology equals { all subsets of X } ≡ 2X
These fulfil all the definitions of a topology (see above).
Definition of a Topological Space
… is the pair (X, T). So, in the above example, (X, T1) and (X, T2) are both topological spaces.
Definition of Open and Closed Sets
All elements of T are called open sets. The complement of all elements of T are called closed sets.
So, for any U ⊂ T which is open, its complement (X \ U) is closed.
Definition of the Usual Topology on ℜ
… is T where
O ∈ T iff ∀ x ∈ O ∃ ε > 0 : ] x − ε, x + ε [ ⊂ O
Definition of Normed Vector Space
∀ x ∈ E, N(x) = 0 ⇔ x = 0
∀ (x, λ) ∈ E x R, N(λ x ) = | λ | N(x)
∀ (x, y) ∈ E x E, N(x) + N(y) ≤ N(x + y)
"If you have all of this, E is a normed vector space."
If the first rule does not apply but the second and third do, then it's a seminorm space.
The Relationship between Spaces
The relation between spaces is explicitly encoded in the Breeze math library written in Scala. Here, we can see the InnerProductSpace trait extend the NormedVectorSpace trait that in turn extends the VectorSpace trait.
[1] An Introduction to Functional Analysis - Coursera.
Sunday 16 February 2014
Sunday 12 January 2014
Gradients and Surfaces
The R Language
I'm going to use the R language for all the graphics in this post since it is free, open source and runs on a variety of platforms (although they will need to support OpenGL. Macs come with this as standard). R is generally used for statistics but it will work in other areas of mathematics. Just don't be too pedantic as to how it does this…
Surfaces
Given a function:
f(x, y) = x^2 + y^2
(where the ^ symbol here uses the R-language notation for "to the power of"), we can generate the plot in the range for x and y of -5 to 5:

The R code for this is:
# load the graphics library
library(rgl)
# define our function
myFunc <- function(x, y) x ^ 2 + y ^ 2
# Let's create a structure called 'data'
data.x = seq(-5, 5, 1) # x is the open set from -5 to 5 in unit steps
data.y = seq(-5, 5, 1) # ditto for y
# create a grid (in namespace 'data.xyz') that holds x and y
data.xyz = expand.grid(x=data.x, y=data.y)
# in this same namespace, add 'z' which uses our function
data.xyz$z = myFunc(data.xyz$x, data.xyz$y)
# some R graphics
nbcol = 100
# rev() means reverse. rainbow() gives us colours
color = rev(rainbow(nbcol, start = 0/6, end = 4/6))
# cut() breaks the data in z into nbcol units
zcol = cut(data.xyz$z, nbcol)
# purely for convenience
mydata = data.xyz
plot3d(mydata $x, mydata$y, mydata$z,
#aspect=FALSE, # scale with the window
xlab="x", ylab="y", zlab="z")
# spread a multi-coloured surface over these points
# note that data.x and data.y are just the unique values for x and y
# whereas data.xyz.$z is all the calculated points using x and y.
# Naturally, length(mydata.$z) = length(data.x) * length(data.y)
surface3d(data.x, data.y, mydata$z, col=color[zcol])
So, as far as our graph goes, the value on the z-axis is f(x, y). Equivalently, we can express this surface as the implicit function:
F(x, y, z) = 0
since
z = f(x, y)
then we can say that for this surface:
F(x, y, z) = 0 = z - f(x, y) = f(x, y) - z
the order of f(x, y) and z in the above equation is significant when we calculate the normal to the surface (it determines whether it points in or out).
The gradient of this function gives us the normal to the surface (see this link for why).
Given:

then
div F = div( f(x, y) - z) = 2x i + 2y j - k
Putting this into our R script:
# c() is built-in R function to make vector-like objects
# matrix() makes matrix-like objects. This one makes a matrix
# of all the vector like collections of x, y and z objects in
# mydata. It has height 3 and a length equal the number
# of data points of x, y and z
mat=matrix(c(mydata$x, mydata$y, mydata$z ), 3, byrow=TRUE)
for (t in seq(1, length(mat)/3, 1)) { # /3 because we have 3 dimensions
dx = 2 * mat[1,t] # from the equation above
dy = 2 * mat[2,t] # from the equation above
dz = -1 # from the equation above
from = mat[,t] # vector of start point
to = c(mat[1,t] + dx, mat[2,t] + dy, mat[3,t] + dz)
vec = rbind(from, to)# list of the start and end point
segments3d(vec) # that makes this line
}
and running it, we get to see the normals of our surface.
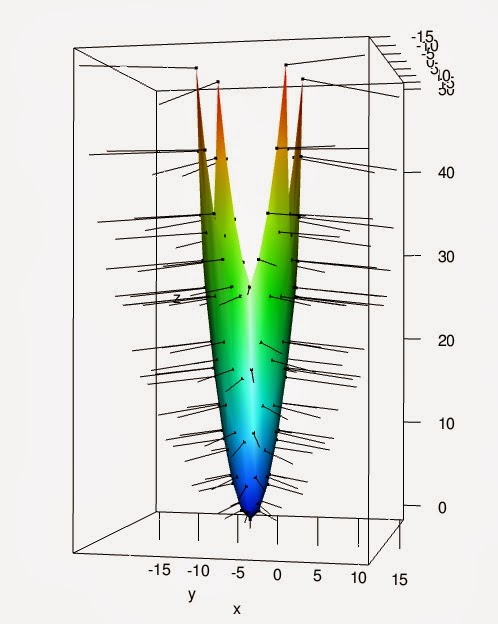
This time, I run the script with the aspect=FALSE uncommented as I want the scaling to be more representative.
I'm going to use the R language for all the graphics in this post since it is free, open source and runs on a variety of platforms (although they will need to support OpenGL. Macs come with this as standard). R is generally used for statistics but it will work in other areas of mathematics. Just don't be too pedantic as to how it does this…
Surfaces
Given a function:
f(x, y) = x^2 + y^2
(where the ^ symbol here uses the R-language notation for "to the power of"), we can generate the plot in the range for x and y of -5 to 5:
The R code for this is:
# load the graphics library
library(rgl)
# define our function
myFunc <- function(x, y) x ^ 2 + y ^ 2
# Let's create a structure called 'data'
data.x = seq(-5, 5, 1) # x is the open set from -5 to 5 in unit steps
data.y = seq(-5, 5, 1) # ditto for y
# create a grid (in namespace 'data.xyz') that holds x and y
data.xyz = expand.grid(x=data.x, y=data.y)
# in this same namespace, add 'z' which uses our function
data.xyz$z = myFunc(data.xyz$x, data.xyz$y)
# some R graphics
nbcol = 100
# rev() means reverse. rainbow() gives us colours
color = rev(rainbow(nbcol, start = 0/6, end = 4/6))
# cut() breaks the data in z into nbcol units
zcol = cut(data.xyz$z, nbcol)
# purely for convenience
mydata = data.xyz
plot3d(mydata $x, mydata$y, mydata$z,
#aspect=FALSE, # scale with the window
xlab="x", ylab="y", zlab="z")
# spread a multi-coloured surface over these points
# note that data.x and data.y are just the unique values for x and y
# whereas data.xyz.$z is all the calculated points using x and y.
# Naturally, length(mydata.$z) = length(data.x) * length(data.y)
surface3d(data.x, data.y, mydata$z, col=color[zcol])
So, as far as our graph goes, the value on the z-axis is f(x, y). Equivalently, we can express this surface as the implicit function:
F(x, y, z) = 0
since
z = f(x, y)
then we can say that for this surface:
F(x, y, z) = 0 = z - f(x, y) = f(x, y) - z
the order of f(x, y) and z in the above equation is significant when we calculate the normal to the surface (it determines whether it points in or out).
The gradient of this function gives us the normal to the surface (see this link for why).
Given:
then
div F = div( f(x, y) - z) = 2x i + 2y j - k
Putting this into our R script:
# c() is built-in R function to make vector-like objects
# matrix() makes matrix-like objects. This one makes a matrix
# of all the vector like collections of x, y and z objects in
# mydata. It has height 3 and a length equal the number
# of data points of x, y and z
mat=matrix(c(mydata$x, mydata$y, mydata$z ), 3, byrow=TRUE)
for (t in seq(1, length(mat)/3, 1)) { # /3 because we have 3 dimensions
dx = 2 * mat[1,t] # from the equation above
dy = 2 * mat[2,t] # from the equation above
dz = -1 # from the equation above
from = mat[,t] # vector of start point
to = c(mat[1,t] + dx, mat[2,t] + dy, mat[3,t] + dz)
vec = rbind(from, to)# list of the start and end point
segments3d(vec) # that makes this line
}
and running it, we get to see the normals of our surface.
This time, I run the script with the aspect=FALSE uncommented as I want the scaling to be more representative.
Sunday 5 January 2014
What's it all about?
I left University over 20 years ago as the proud owner of a physics degree. Since then, I've spent most of my time as a software engineer. It's been great fun but I miss pure mathematics and science.
I've recently returned to them in my spare time but what frightened me is how little I understood my old lecture notes. This blog is addressing that as I try to remember what I once knew and maybe learn a little more.
I apologise if my reasons for doing this appear entirely selfish. However, if you once knew maths, you might enjoy this refresher.
Subscribe to:
Posts (Atom)